HBAR experienced a 24.56% monthly drop, largely due to the October 10 crash, but breached a key $0.195 high on October 13. A recent correction from November 1 highlights supply pressure between $0.19 and $0.20, with the Relative Strength Index (RSI) showing mixed signals. Bitcoin’s stability above $100,000 offers altcoin recovery potential, though HBAR must overcome downtrends and key resistances for a bullish reversal. Data from CoinMarketCap confirms a decline in trading volume.
## HBAR Price Prediction Amid Recent Corrections and Bullish Shifts
Explore the HBAR price prediction amid recent corrections and bullish shifts. This in-depth analysis covers key levels, momentum indicators, and short-term outlooks for Hedera’s token. Stay informed on crypto trends—read on for actionable insights.
### What is the HBAR Price Prediction for the Short Term?
The short-term HBAR price prediction points to a likely rejection at the $0.176 local resistance level in the coming hours. This is driven by weakening buying pressure and a 50% drop in daily trading volume. Despite a modest 1.29% increase over the last 24 hours, the token remains down 14.7% from the previous week, according to CoinMarketCap figures.
A sustained break above $0.195 could signal a stronger recovery, but current indicators suggest caution for traders.
### Recent Price Action and Market Behavior
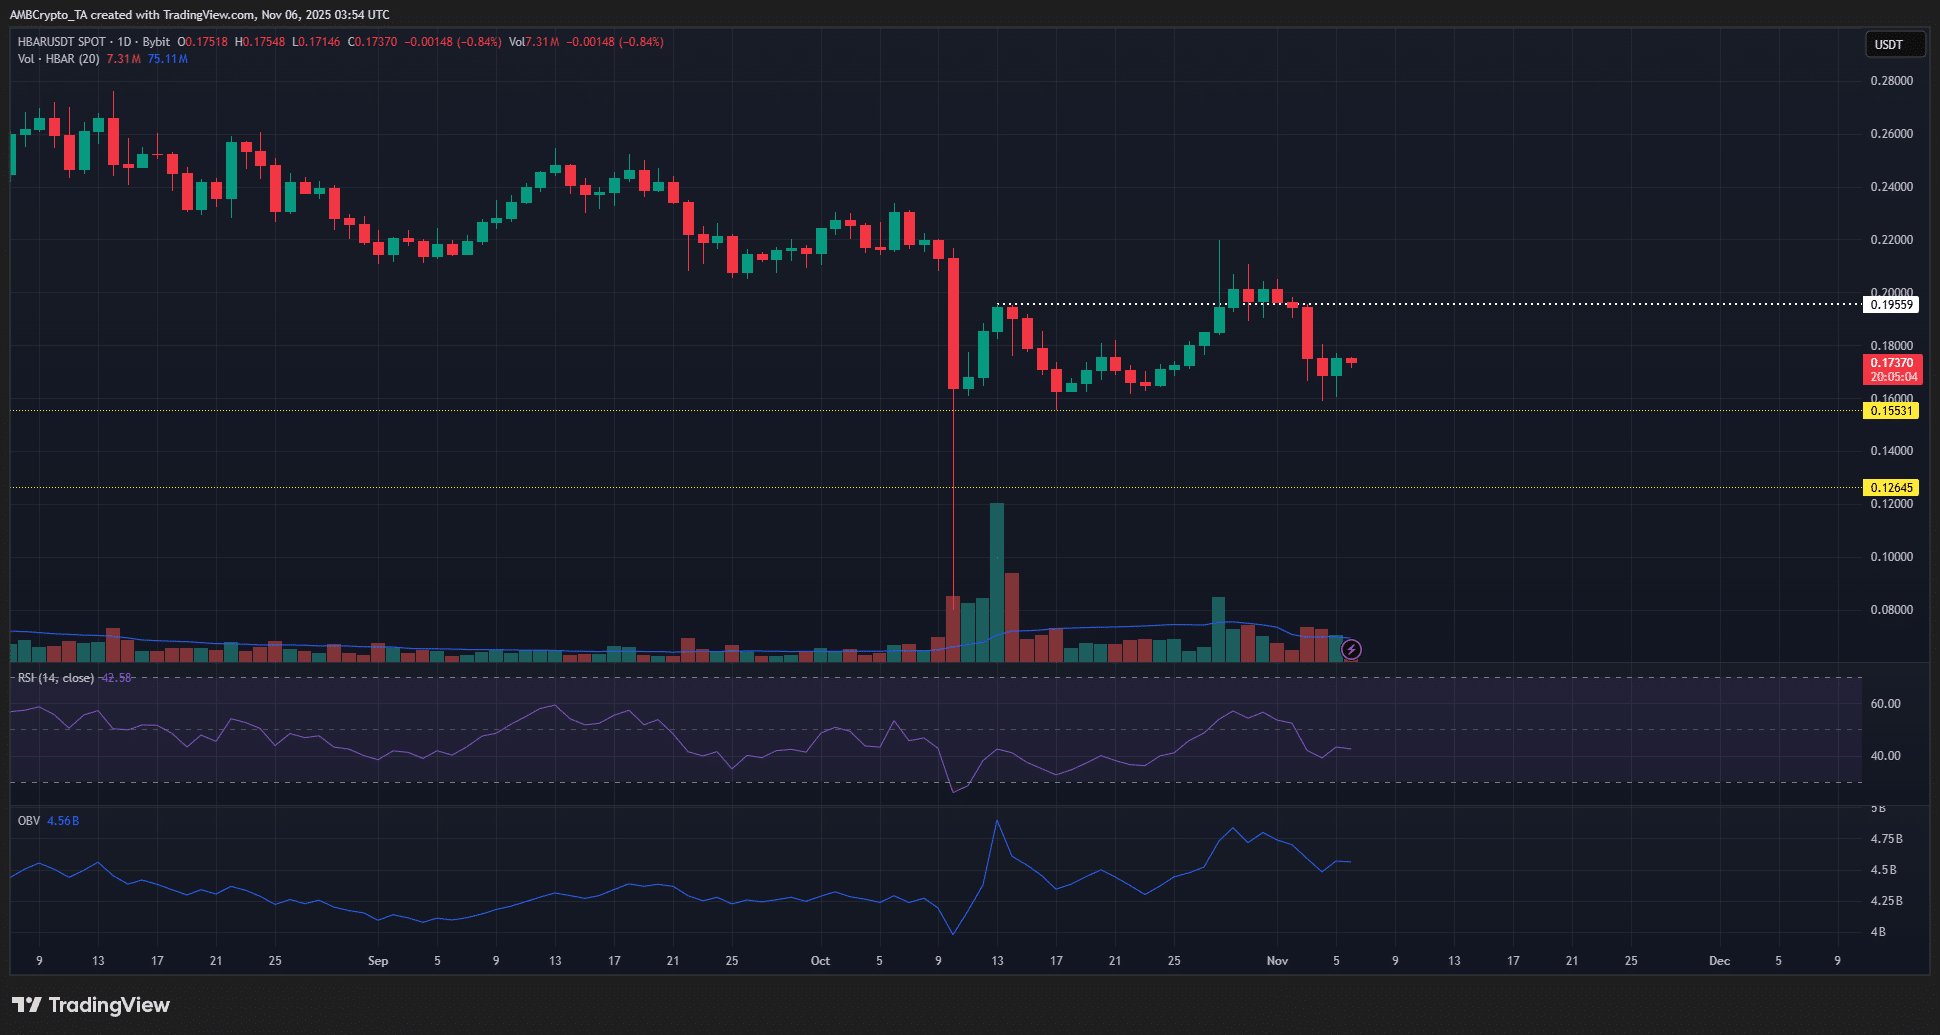
Hedera’s HBAR has faced significant pressure over the past month, declining 24.56% overall, with much of the downturn tied to the sharp market correction on October 10. Since October 13, however, the price has pushed beyond a local swing high of $0.195, marking a notable bullish shift in the daily structure after months of decline beginning in mid-August.
This development underscores growing buyer interest, though reclaiming pre-correction levels will require sustained momentum.
### Technical Indicators
On the daily chart, the Relative Strength Index (RSI) registers at 42.6, reflecting mildly bearish conditions. In contrast, the On-Balance Volume (OBV) has formed higher lows and highs over the last three weeks, indicating accumulating volume that supports potential upside.
These conflicting signals—bearish RSI versus bullish OBV and structure—point to HBAR’s ongoing recovery attempt, even as a fresh correction unfolded on November 1.
### Market Context and Resistance Levels
Bitcoin’s position above $100,000 provides a favorable backdrop for altcoins like HBAR, but breaking entrenched downtrends remains essential for a full bullish reversal. Market participants note that while the broader crypto environment offers hope, HBAR’s path forward hinges on overcoming key resistances.
Analysts from platforms like TradingView emphasize that volume trends must improve to validate the structural shift, avoiding a flat or failed bounce.
The hourly chart displays robust supply zones between $0.19 and $0.20, where selling pressure has consistently capped gains. Over the past day, a bullish structure change has emerged, yet the price continues to probe the pivotal $0.176 swing level.
Short-term RSI exhibits bullish divergence, hinting at possible upward momentum. However, the hourly OBV reveals subdued buying activity, raising the risk of further downside for HBAR.
This imbalance suggests that bulls need stronger conviction to push beyond current hurdles, especially with altcoin downtrends persisting in the market.
—
## Frequently Asked Questions
**What is the significance of HBAR moving past $0.195 in late October?**
The breach of $0.195 on October 13 signaled a bullish structure shift for HBAR, ending a downtrend that began in mid-August. This level acted as a key resistance, and surpassing it demonstrated buyer strength, potentially setting the stage for recovery despite ongoing market volatility. Data from TradingView supports this as a positive inflection point.
**What is the short-term HBAR price outlook?**
In the short term, HBAR’s price may face rejection at $0.176 due to weak hourly buying pressure and declining volume. While daily indicators show some bullish potential, traders should monitor for a break above $0.19 to confirm upward momentum.
—
## Key Takeaways
– **Bullish structure shift:** HBAR’s move above $0.195 in late October marks a key reversal after extended declines, bolstered by rising OBV trends.
– **Volume concerns:** A nearly 50% drop in daily trading volume, per CoinMarketCap, tempers recovery hopes and highlights weak short-term buying pressure.
– **Resistance watch:** Monitor $0.176 and the $0.19–$0.20 zones closely; a decisive break could signal broader altcoin upside amid Bitcoin’s stability.
—
## Conclusion
Hedera’s HBAR price prediction reflects a delicate balance between recent bullish shifts and persistent resistances, influenced by volume declines and mixed momentum indicators like RSI and OBV.
As Bitcoin holds above $100,000, HBAR has opportunities for rebound, but short-term traders must navigate potential rejections carefully. Looking ahead, sustained buying could drive meaningful recovery—consider tracking these levels for informed decisions in the evolving crypto landscape.
—
*Disclaimer: The information presented does not constitute financial, investment, trading, or other types of advice and is solely the writer’s opinion.*
https://bitcoinethereumnews.com/tech/hbar-eyes-recovery-after-bullish-shift-but-short-term-rejection-at-0-176-looms/