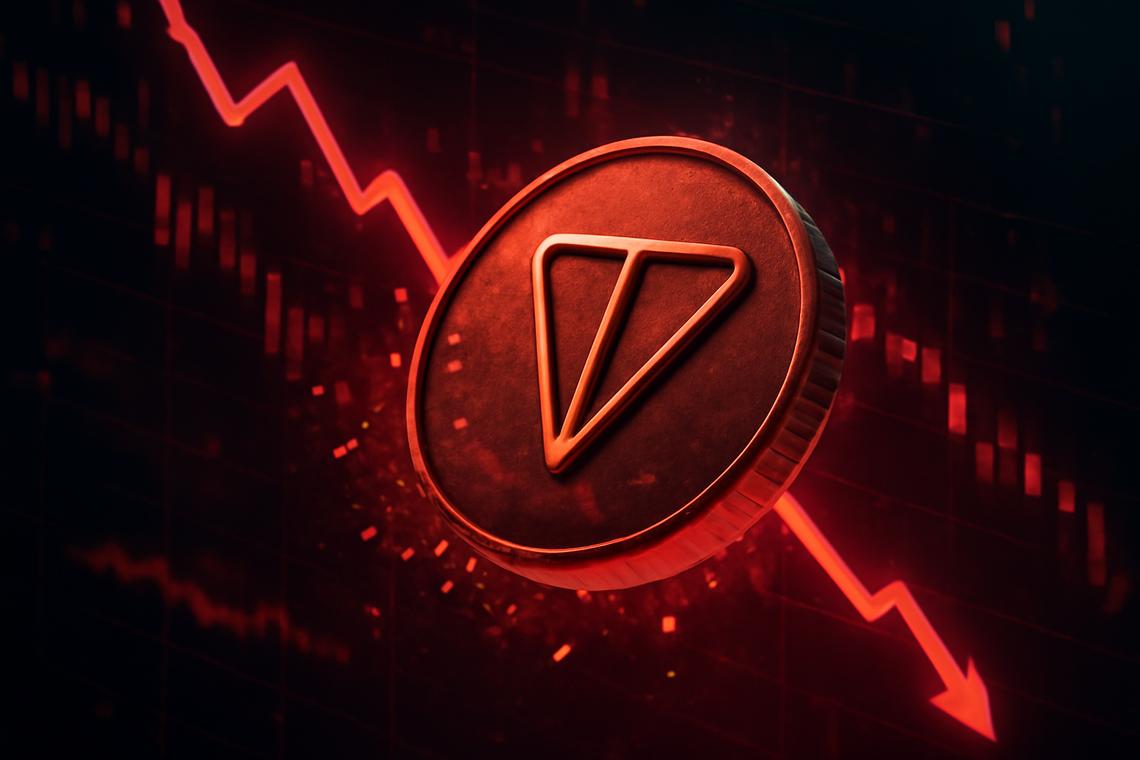
Telegram TON crypto is trading through a fragile phase where sentiment, liquidity and technicals all point to a market under stress. Yet, as so often happens in crypto, extreme fear can also prepare the ground for the next meaningful move, which this analysis aims to map out. Summary The broader crypto market is consolidating, with total capitalization around $3. 21 trillion and a slight negative daily change. Bitcoin dominates with nearly 57% market share, limiting risk appetite for altcoins and pushing capital toward relative safety. Meanwhile, the Fear & Greed Index sits in Extreme Fear at 11, confirming that investors are defensive and reactive. On the daily chart, TONUSDT trades below all major EMAs, signalling a mature bearish regime rather than a fresh downtrend. Volatility is moderate, with daily ATR at 0. 12, leaving space for moves without indicating panic. Overall, intraday charts show oversold but stabilising conditions, suggesting bears are still in control but losing some momentum. Telegram TON crypto: Market Context and Direction The macro backdrop is not particularly supportive for a rapid rebound in this token. Total crypto capitalization hovers just above 3. 2 trillion dollars, and the 24-hour market cap change is marginally negative, indicating mild but broad-based selling. Moreover, Bitcoin’s dominance at about 56. 97% highlights a risk-off market regime, where traders rotate into the largest asset while trimming exposure to more volatile names. In contrast, the sentiment data underline how defensive the environment has become. The Fear & Greed Index at 11, deep in the “Extreme Fear” zone, points to capitulation-like psychology, where investors are quicker to sell rallies than to buy dips. That said, such extremes often mark late stages of broader corrections. For TONUSDT, this context means any bounce is likely to face scepticism, yet a surprise upside move could be amplified if shorts become crowded. Technical Outlook: reading the overall setup On the daily timeframe, the asset trades near 1. 71, clearly below the 20-day EMA at 1. 94, the 50-day at 2. 20 and the 200-day at 2. 86. This configuration confirms a well-established downside trend, where rallies towards short or medium EMAs are more likely to attract sellers than to start a new bull leg. The daily RSI around 30. 1 sits right at the threshold of oversold territory. This level implies that bearish momentum has been intense, but it is also entering a zone where downside pressure can begin to exhaust. However, unless RSI starts to bounce decisively above 40, it mainly signals persistent weakness rather than a clear reversal. The MACD on the daily chart shows its line at -0. 14, only slightly below the signal at -0. 12, with a modest negative histogram. This tells us that the downtrend is still in place but that bearish momentum is flattening, hinting at consolidation rather than acceleration to the downside. If the MACD line crosses above the signal while still below zero, it would support a scenario of a corrective rebound inside a broader bearish structure. Bollinger Bands add another layer to the picture. The mid-line near 1. 97 sits well above current price, with the lower band around 1. 63. Trading close to the lower band usually denotes persistent selling pressure, yet the relatively narrow band width signals there is no volatility blowout. This combination favours a grinding consolidation with occasional spikes, instead of a sharp crash or explosive rebound. ATR at 0. 12 on the daily timeframe indicates moderate daily swings. As a result, traders should expect controlled volatility where trend continuation moves can develop over several sessions rather than in single, violent candles. Intraday Perspective and TONUSDT token Momentum On the hourly chart, price is again around 1. 71, slightly below the 20, 50 and 200 EMAs, clustered between 1. 73 and 1. 85. This tight grouping of moving averages above price reflects a compressed but still bearish intraday structure, where every attempt to push higher quickly meets supply. Meanwhile, the hourly RSI near 34. 7 suggests intraday conditions are weak but not as stretched as on the daily timeframe. This allows room for short-lived rebounds without changing the broader bias. The MACD is almost flat with both line and signal around -0. 01 and a near-zero histogram, indicating momentum neutrality on very short timeframes after the recent decline. On the 15-minute chart, EMAs (20, 50 and 200) cluster tightly between 1. 72 and 1. 75, again slightly above spot. As a result, short-term traders are facing a market where small intraday bounces into these averages are likely to be sold, keeping a sell-on-rally playbook intact. Key Levels and Market Reactions Daily pivot levels show the central reference point at 1. 72, almost exactly where price is oscillating. This area acts as an immediate battleground between bulls trying to stabilise and bears defending recent gains. Just above, a first resistance zone emerges around 1. 73, near the pivot’s upper level, where sellers could step in to protect the prevailing trend. On the downside, the first notable support area lies around 1. 69, close to the daily pivot’s lower level and not far from the lower Bollinger Band at 1. 63. A decisive break below this range would signal trend continuation to the downside, opening space for deeper corrections as sentiment is already fragile. Conversely, if buyers manage to defend this band and push back above 1. 73, it would reinforce the idea of short-term base-building inside a broader bearish channel. Future Scenarios and Investment Outlook Overall, Telegram TON crypto is trading inside a clear bearish regime, but several indicators hint that the strongest phase of selling may be slowing. For conservative investors, patience remains a virtue: waiting for daily closes back above the 20-day EMA and a sustained RSI recovery would offer stronger evidence of a durable reversal. More active traders might look for tactical long opportunities near support zones, but only with tight risk management, acknowledging that the primary bias still favours the bears. Until market sentiment improves and Bitcoin dominance relaxes, altcoins such as this one will likely face headwinds on every rally. Nevertheless, as fear dominates and volatility stays manageable, the foundations for the next medium-term swing are quietly being laid, rewarding those who combine technical discipline with measured risk exposure.
https://bitcoinethereumnews.com/tech/3-key-levels-for-next-move/
3 key levels for next move